NEET 2020 Physics Question 163 Solution
Question
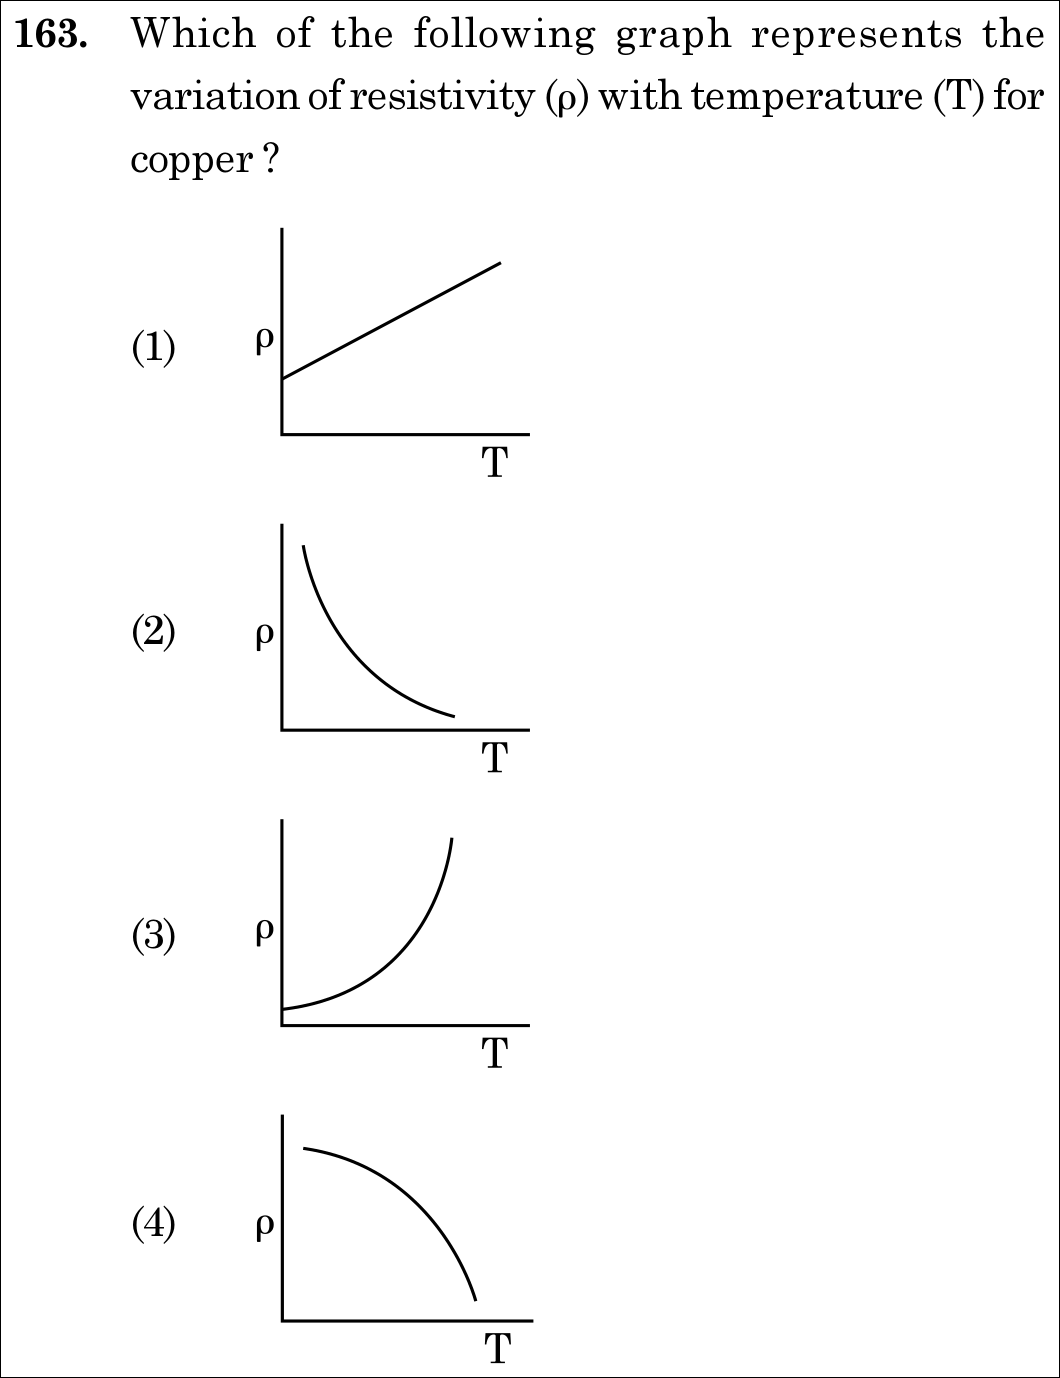
Which of the following graph represents the variation of resistivity (ρ) with temperature (T) for copper?
Dynamic 180-question full-length simulator mixed dynamically from all 6 years for 2027 & 2026 aspirants.
Which of the following graph represents the variation of resistivity (ρ) with temperature (T) for copper?
In standard NCERT, resistivity of copper vs temperature in Kelvin is plotted as a non-linear curve starting very low near 0 K and curving upwards (concave upward). Semiconductor resistivity decreases exponentially, alloys like Nichrome have a high non-zero intercept with linear rise, but pure copper displays the curved non-linear rise of Graph (3)!
For metals, resistivity is given by Drude-Lorentz model: , where is the free electron density and is relaxation time. As temperature increases, lattice vibrations (phonons) increase, shortening and increasing .
For pure metals such as copper, at temperatures close to absolute zero ( to ), resistivity increases non-linearly with temperature (proportional to according to quantum electron-phonon scattering theory).
As temperature exceeds , the rate of increase settles into a nearly linear dependence (). Thus the full plot starting from curves upward initially.
- Graph 1: Decreasing exponential (typical of intrinsic semiconductors). - Graph 2: Constant horizontal line (temperature-independent ideal resistor). - Graph 3: Curved upward non-linear plot starting near origin (exact NCERT plot for Copper). - Graph 4: Pure straight line passing through origin (neglects quantum low-temperature non-linearity). Therefore, Graph 3 is the correct representation.
Diagnose every choice: Know exactly why the right option works and why distractors fail.
Incorrect; depicts semiconductor behavior where thermal excitation generates more charge carriers.
Incorrect; depicts a zero temperature coefficient material (ideal standard resistor), not pure copper.
Canonical NCERT curve for copper showing non-linear increase at low T transitioning to linear at higher T.
Incorrect; ignores the well-known low-temperature non-linear curvature in pure copper.
The formula is a linear approximation over narrow temperature ranges. Over the full range from 0 K, the curve is distinctly non-linear.
""
Test your speed and accuracy in the authentic 180-minute timed NTA simulator.
Spotted a mistake in this solution? Report an error ([email protected])
Cover all 1,140 official NEET questions in 285 days at your own pace. Progress is saved on your device. No login needed.