MyCompetitiveExams Logo MyCompetitiveExams
Search 1,140+ Questions
Chapters, formulas, speed tricks
→
⚡ Brahmastra NEET 2027
720 MARKS

Dynamic 180-question full-length simulator mixed dynamically from all 6 years for 2027 & 2026 aspirants.

Launch Brahmastra 2027 Test →
Start Practice →
100% Free · No Login Required
Q.42 Physics · Section B ⭐ 360° Option Elimination Active
Vault ↗

NEET 2024 Physics Question 42 Solution

Topic: Kinetic Theory of Gases · Official NTA Booklet Code T1
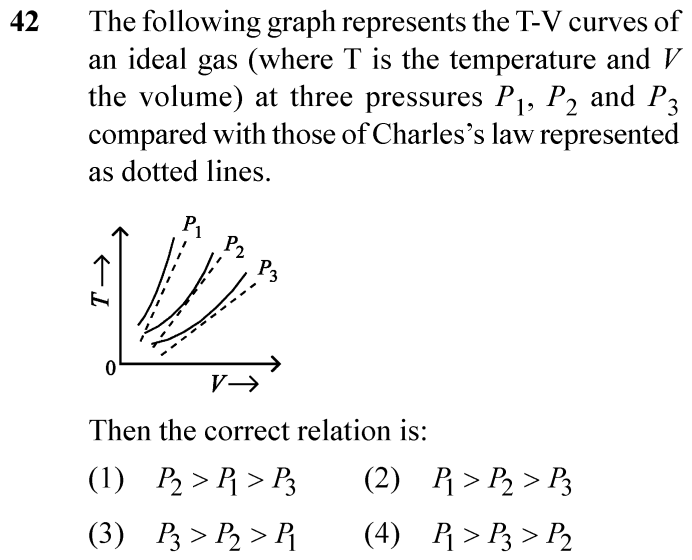
NEET 2024 Physics Question 42: Comparison of Pressures from T-V Curves

Question

The following graph represents the T-V curves of an ideal gas (where T is the temperature and V the volume) at three pressures P₁, P₂ and P₃ compared with those of Charles's law represented as dotted lines. Then the correct relation is:

✓
Verified Against NTA Final Answer Key
Option (2) : P₁ > P₂ > P₃
📚 Kinetic Theory of Gases Easy
📋 Given Parameters & Problem Setup
Ideal gas curves T-V plots at three pressures P₁, P₂, P₃
Dotted lines Charles’s law lines passing through origin
⚡

The 30-Second Exam Hall Shortcut: ⚡ Isochore Vertical Line Cut Hack

⏱️ Save ~40 seconds

Draw a vertical line at constant volume V: Higher T means higher pressure (P ∝ T at constant V) -> Curve P₁ is on top -> P₁ > P₂ > P₃!

1 Ideal gas equation: PV = nRT => P = (nR / V) · T.
2 Draw an imaginary vertical line at a fixed volume V = V_0 across all three curves.
3 At this fixed volume, read the corresponding temperatures: T₁ > T₂ > T₃.
4 By Gay-Lussac’s law (P ∝ T at constant V): Higher T means HIGHER P.
5 Therefore, P₁ > P₂ > P₃.
6 Option (2) in under 5 seconds!
🛡️
Why You Can 100% Trust This Shortcut: Ideal Gas Equation of State (PV = nRT; Slope of T vs V at constant P is P / nR).
📐

Step-by-Step Rigorous Workflow & Mathematical Proof

Step 1

Ideal Gas Law Formulation for T-V Axes

For an ideal gas, the equation of state is PV = nRT. Expressing temperature T as a function of volume V:

T=(PnR)VT = \left(\frac{P}{n R}\right) V
Step 2

Slope Analysis of T-V Plots

The graph plots T on the vertical axis and V on the horizontal axis. For an isobaric line representing Charles’s law, the slope is:

Slope=dTdV=PnR\text{Slope} = \frac{dT}{dV} = \frac{P}{n R}
Step 3

Relation Between Slope and Pressure

Because n and R are constants, the slope of the T-V line is directly proportional to pressure P. A steeper line corresponds to a higher pressure:

Slope∝P\text{Slope} \propto P
Step 4

Comparative Evaluation

From the given graph, curve P₁ is the steepest (highest slope), curve P₂ has intermediate slope, and curve P₃ has the lowest slope (gentlest inclination):

Slope1>Slope2>Slope3  ⟹  P1>P2>P3\text{Slope}_1 > \text{Slope}_2 > \text{Slope}_3 \implies P_1 > P_2 > P_3
⭐

360° Option Elimination Engine Key Feature

Diagnose every choice: Know exactly why the right option works and why distractors fail.

4-Option Deep Scan
1 (1)
✗ Incorrect
Verdict & Scientific Reason:

Places P₂ as largest, which has an intermediate slope.

⚠️
Student Fallacy (Why candidates pick this trap): Misreading curve ordering.
2 (2)
✓ 100% Correct
Verdict & Scientific Reason:

Exact physical ranking: steeper T-V curve indicates greater pressure.

💡
Why this is airtight: None.
3 (3)
✗ Incorrect
Verdict & Scientific Reason:

Completely inverts the pressure hierarchy.

⚠️
Student Fallacy (Why candidates pick this trap): Confusing T-V graph with V-T graph (where slope would be nR/P).
4 (4)
✗ Incorrect
Verdict & Scientific Reason:

Jumbled ordering of P₂ and P₃.

⚠️
Student Fallacy (Why candidates pick this trap): Careless comparison.
⚠️

NTA Trap Alert: T-V vs V-T Axis Inversion Trap

Most textbook problems plot V on the y-axis and T on the x-axis (where slope = nR/P, so higher slope means LOWER pressure). In this question, axes are reversed: T is on the y-axis!

🛡️ How to avoid the -1 mark: Always check axes labels: T is vertical, V is horizontal. When in doubt, draw a constant V vertical line: higher T = higher P!
📖

Core NEET Syllabus Standard

Physics Core Thermal Physics · Kinetic Theory Standard Benchmark
Core Scientific Principle Tested:

"On a T versus V plot, the slope of an isobar is P/nR; higher slope directly indicates higher pressure."

Syllabus Focus: Ideal Gas Laws and Graphical Representations
✓ Core NEET UG Syllabus Anchor Syllabus & Academic Standards ↗
T on Top means Pressure is High: Steepest slope reaches the sky (P₁ > P₂ > P₃)!

Ready to attempt under real exam pressure?

Test your speed and accuracy in the authentic 200-minute timed NTA simulator.

Launch NEET 2024 CBT Test →

Spotted a mistake in this solution? Report an error ([email protected])

⚖️ Legal & Fair Dealing Notice: Sourced from publicly released NEET 2024 question papers and NEET answer keys for private study, research, and non-commercial educational practice under Fair Dealing (Section 52(1)(a) of the Indian Copyright Act, 1957). Not affiliated with or endorsed by NTA or NMC.

Solve 4 NEET Questions a Day — One per Subject

Cover all 1,140 official NEET questions in 285 days at your own pace. Progress is saved on your device. No login needed.